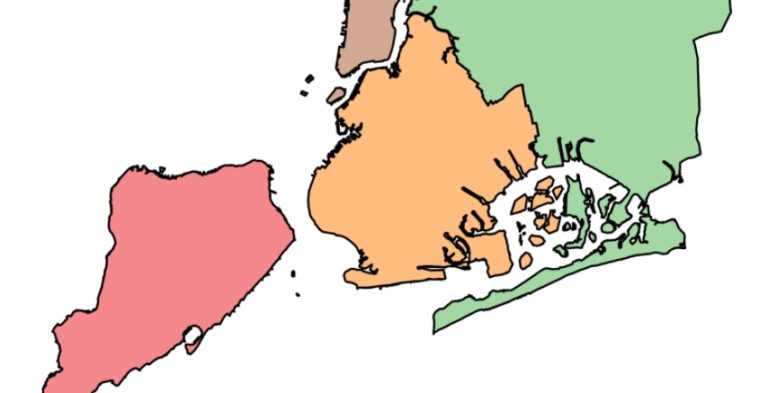
This field is referred to as geospatial analysis. Geospatial analysis applies statistical analysis to data that has geographical or geometrical components. In this tutorial, we’ll use Python to learn the basics of acquiring geospatial data, handling it, and visualizing it. More specifically, we’ll do some interactive visualizations of the United States!
https://www.twilio.com/blog/2017/08/geospatial-analysis-python-geojson-geopandas.html
HN comments:
- Using geojson.io to visualise the GeoJSON seems like the wrong tool for the job; just use folium, it works perfectly in Jupyter Notebooks: https://github.com/python-visualization/folium
- You might also be interested in GeoNotebook, a Jupyter Notebook extension for geospatial analysis https://github.com/OpenGeoscience/geonotebook
- If you are interested in GIS, make sure to check out rasterio and Fiona to go with Shapely. All great tools for GIS in python.
- For JavaScript folks, there’s Turfjs from Mapbox. http://turfjs.org/