Composing Programs – Python 3 in the tradition of SICP

http://composingprograms.com/pages/11-getting-started.html

From HN https://news.ycombinator.com/item?id=11465234:

This is the textbook used for the introductory CS course (CS61A) at Berkeley. The course material is available at http://cs61a.org (The course uses Python 3, Scheme, and SQL). There are some neat projects (students are working on building a Scheme interpreter now)

Previous Hacker News Discussions:

https://news.ycombinator.com/item?id=3491142

https://news.ycombinator.com/item?id=3141996

Overall, SICP in Python 3 is first rate. I highly recommend it to anyone wanted to improve their sophistication with Python and programming in general.

The exercises and demonstrations in each section quickly build from an elementary introduction up to powerful examples accompanied by clear explanations. I especially like the explanatory diagrams.

Thank you to the authors for your craftsmanship and for making it available on-line.
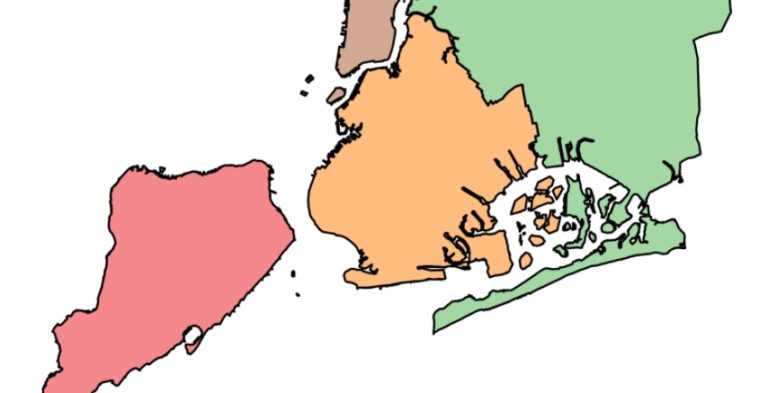
Getting Started on Geospatial Analysis with Python GeoJSON and GeoPandas

This field is referred to as geospatial analysis. Geospatial analysis applies statistical analysis to data that has geographical or geometrical components. In this tutorial, we’ll use Python to learn the basics of acquiring geospatial data, handling it, and visualizing it. More specifically, we’ll do some interactive visualizations of the United States!

https://www.twilio.com/blog/2017/08/geospatial-analysis-python-geojson-geopandas.html

HN thread

HN comments:

How to Generate FiveThirtyEight Graphs in Python – dataquest.io

If you read data science articles, you may have already stumbled upon FiveThirtyEight’s content. Naturally, you were impressed by their awesome visualizations. You wanted to make your own awesome visualizations and so asked Quora and Reddit how to do it. You received some answers, but they were rather vague. You still can’t get the graphs done yourself.

https://www.dataquest.io/blog/making-538-plots/

HN thread