
The Smithy

  • Home
  • Data Visualization
  • Login

Tag: infographics

rough.js – create graphics with a hand-drawn, sketchy, appearance

March 9, 2021March 9, 2021 TheSmithy

https://roughjs.com/

Rough.js

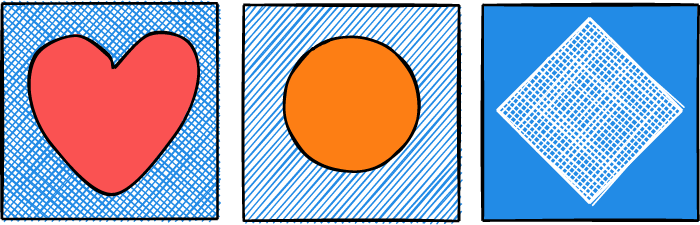
Rough.js is a small (<9kB gzipped) graphics library that lets you draw in a sketchy, hand-drawn-like, style. The library defines primitives to draw lines, curves, arcs, polygons, circles, and ellipses. It also supports drawing SVG paths.

Rough.js works with both Canvas and SVG.

Rough.js sample
Read More

World Poverty Clock

February 25, 2019February 25, 2019 TheSmithy

https://worldpoverty.io/

Timeline Maps (David Rumsey Map Collection)

May 24, 2018May 24, 2018 TheSmithy

A lot of great examples of timeline maps

https://www.davidrumsey.com/blog/2012/3/28/timeline-maps

Interactive atlas of world history

May 24, 2018May 24, 2018 TheSmithy

https://atlasofworldhistory.com/

Sustainable Seas

May 24, 2018May 24, 2018 TheSmithy

http://vembryrsig.hallbarahav.nu/?lang=en_GB

Infographic klimaatagenda / Ministerie van Infrastructuur en Milieu

December 8, 2016December 8, 2016 TheSmithy

Het klimaat verandert. De gemiddelde temperatuur stijgt, in Nederland nog sneller dan elders in de wereld. Hoe werkt klimaatverandering en wat betekent dit concreet voor ons? Hoe kunnen we extreme klimaatverandering voorkomen en ons tegelijk aanpassen aan onvermijdelijke gevolgen?

Source: Infographic klimaatagenda / Ministerie van Infrastructuur en Milieu

How Search Works – The Story – Inside Search – Google

October 10, 2016October 10, 2016 TheSmithy

Source: How Search Works – The Story – Inside Search – Google

xkcd – a timeline of earth’s average temperature

September 13, 2016September 13, 2016 TheSmithy

http://imgs.xkcd.com/comics/earth_temperature_timeline.png

Dutch Design Daily: Information design – Pakhuis de Zwijger

June 23, 2016June 23, 2016 TheSmithy

Met o.a. Catalogtree, Schwandt Infographics, CLEVER°FRANKE en Roel Stavorinus

Source: Dutch Design Daily Live #7: Information design – Pakhuis de Zwijger

Read More

Minisymposium Infographics

May 10, 2016June 23, 2016 TheSmithy

Hoe werken de verschillende disciplines van vormgeving, techniek en journalistiek samen om tot aansprekende infographics en visuele, digitale verhalen te komen

Read More

Meta

  • Log in
  • Entries feed
  • Comments feed
  • WordPress.org

Categories

  • AI
  • Art
  • Articles and Links
  • Beautiful
  • Books
  • Choir
  • Climate and sustainability
  • Computers
  • Data Visualization
  • DIY
  • Funny
  • Futurology
  • Games
  • Graphic Design
  • Health
  • History
  • Interesting
  • Life
  • LPT
  • Movies and TV
  • Music
  • Productivity
  • Programming
  • Science
  • Security and Privacy
  • Uncategorized
  • Web Design
  • Web Development
  • Wordpress
  • Workflow

Tags

AI animation articles books build tools climate change color CSS data mining data science data visualization deep learning frameworks git guitar html icons images infographics inspiration js keep organized learn libraries maps open source optimization PHP resources responsive sass security SEO server styleguides sustainability svg tools video vue.js wamp wordpress workflow wp-plugin Youtube

Recent Posts

  • SecureAI Tools: Open source alternative to ChatGPT and ChatPDF-like AI tools
  • Blot.im – turn folders into a website
  • A Hackers’ Guide to Language Models – Jeremy Howard
  • Free Online PO File Translator (automatic)
  • Learning Agile Soccer Skills for a Bipedal Robot with Deep Reinforcement Learning
sparkling Theme by Colorlib Powered by WordPress