Tag: data visualization
Creative Coding with Canvas & WebGL – Course
Learn to use Canvas and WebGL with ThreeJS in this JavaScript course on Creative Coding! Tour the vast landscape of graphics programming on the web. Learn about generative art, interactive animations, 3D graphics with ThreeJS, and custom shaders in GLSL. These are the fundamental concepts behind creative development work, including VR/AR apps, games, art installations, interactive web experiences, and various other forms of computational arts.
This course and others like it are available as part of our Frontend Masters video subscription.
Dutch Design Daily: Information design – Pakhuis de Zwijger
Met o.a. Catalogtree, Schwandt Infographics, CLEVER°FRANKE en Roel Stavorinus
Source: Dutch Design Daily Live #7: Information design – Pakhuis de Zwijger
Minisymposium Infographics
Hoe werken de verschillende disciplines van vormgeving, techniek en journalistiek samen om tot aansprekende infographics en visuele, digitale verhalen te komen
Interactive JavaScript charts for your webpage | Highcharts
Saw http://tool.globalcalculator.org/ using this:
Highcharts – Interactive JavaScript charts for your web pages.
Source: Interactive JavaScript charts for your webpage | Highcharts
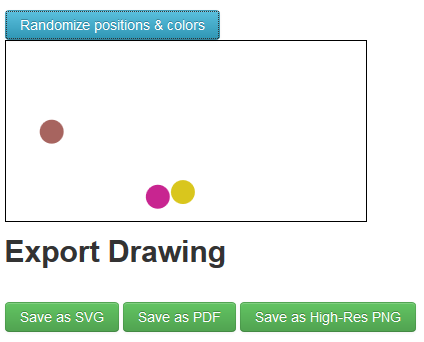
d3js/SVG Export demo
This website demonstrates one possible method of saving d3js graphics to PDF.
Click “view source” on above website to see the client-side code. It is heavily documented.
The server-side code is a bare-bones Perl/CGI script.. It basically runs rsvg-convert and returns the result as an attachment to download. You can implement the same functionallity in any programming language.
The entire code is available on GitHub